Research Development Map: Preserving Questions Before They Became a Story
Purpose
This page preserves a set of surviving working diagrams together with later research investigations and the connections I can currently observe among them.
It is not an intellectual genealogy.
I cannot reliably reconstruct a single origin for many of these ideas, and I do not want later coherence to be projected backward onto earlier work. Some diagrams have uncertain dates or uncertain relative order. Where chronology is not documented, it remains unknown.
The purpose is narrower:
Preserve what can still be observed about the questions, distinctions, failed explanations, provisional hypotheses, and structural connections that existed at different points in the research process.
The diagrams matter because prose tends to turn development into a clean story. A working diagram can preserve something prose often erases: branches that did not converge, explanations that failed, unresolved variables, and questions that remained open.
How to Read the Map
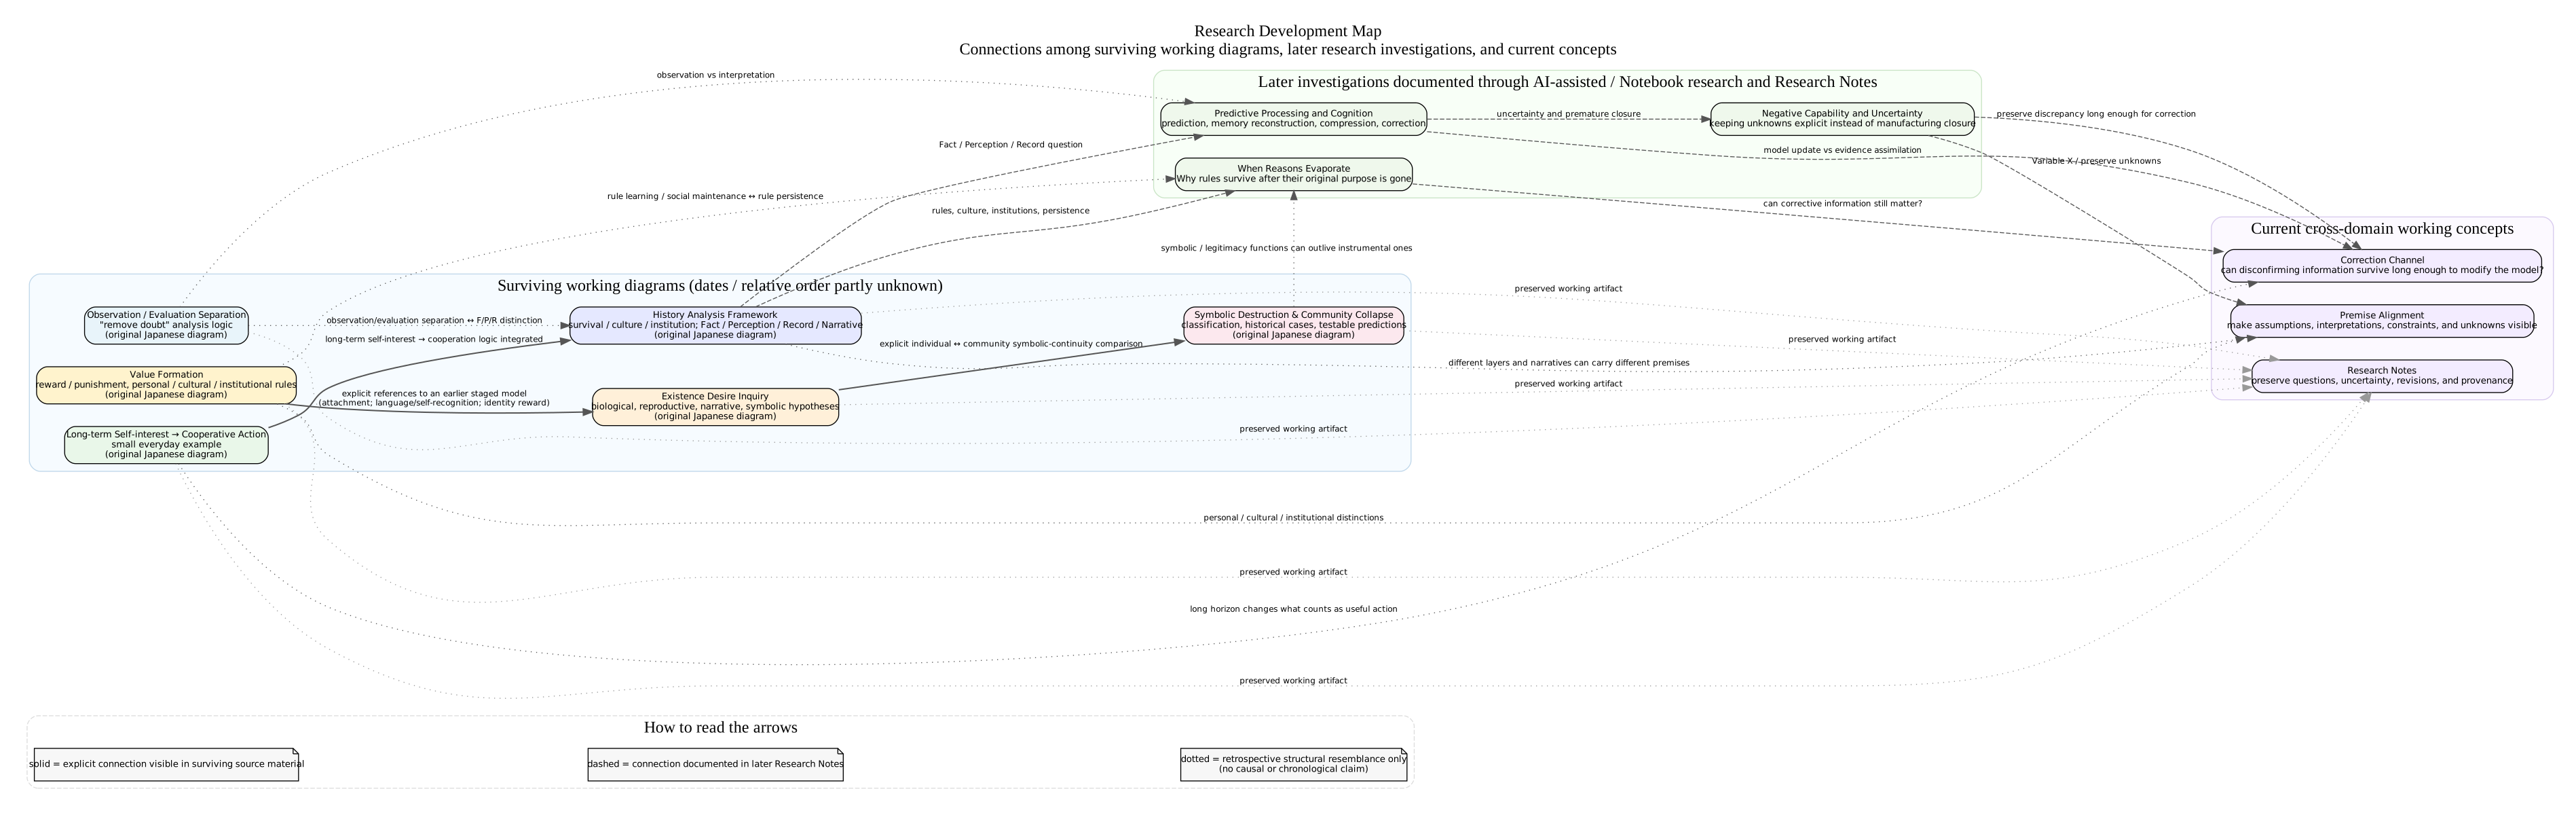
The arrows in this map do not all mean the same thing.
- Solid line: an explicit connection is visible in surviving source material.
- Dashed line: a connection is documented in later Research Notes.
- Dotted line: a structural resemblance is visible retrospectively, but no causal or chronological lineage is claimed.
The map is therefore a map of observable relationships, not a claim that one idea necessarily caused another.
Preservation and Verification Warning
The original diagrams on this page are preserved as historical working artifacts, not as verified evidence. They may contain factual errors, simplified historical examples, overextended causal claims, outdated terminology, or hypotheses I would now state more cautiously.
The original DOT files are not silently corrected. Where later verification changes my view, the correction belongs in the annotation layer or a later note.
Do not cite claims inside the original diagrams as verified history, neuroscience, psychology, or established theory without checking the underlying sources independently.
Research Trail Diagrams
The following diagrams are preserved as historical working artifacts. The original DOT content is kept unchanged. SVG files are generated renderings for human reading, and web-friendly DOT aliases contain the same source bytes under ASCII filenames.
1. Observation / Evaluation Separation
Original:
「疑う」というステップを排除した分析ロジック3.dot

This small diagram attempted to separate an initial pass of observation and fact extraction from a later pass in which personal values were reintroduced for evaluation.
Its language is stronger than I would use now. In particular, I would no longer describe human observation as "pure objective observation." What remains important is the earlier attempt to prevent evaluation from disappearing into the observation record.
Retrospective connection: this resembles, but does not prove the origin of, later distinctions among fact, perception, record, interpretation, and premise.
2. Value Formation
Original: 価値観の形成5.dot
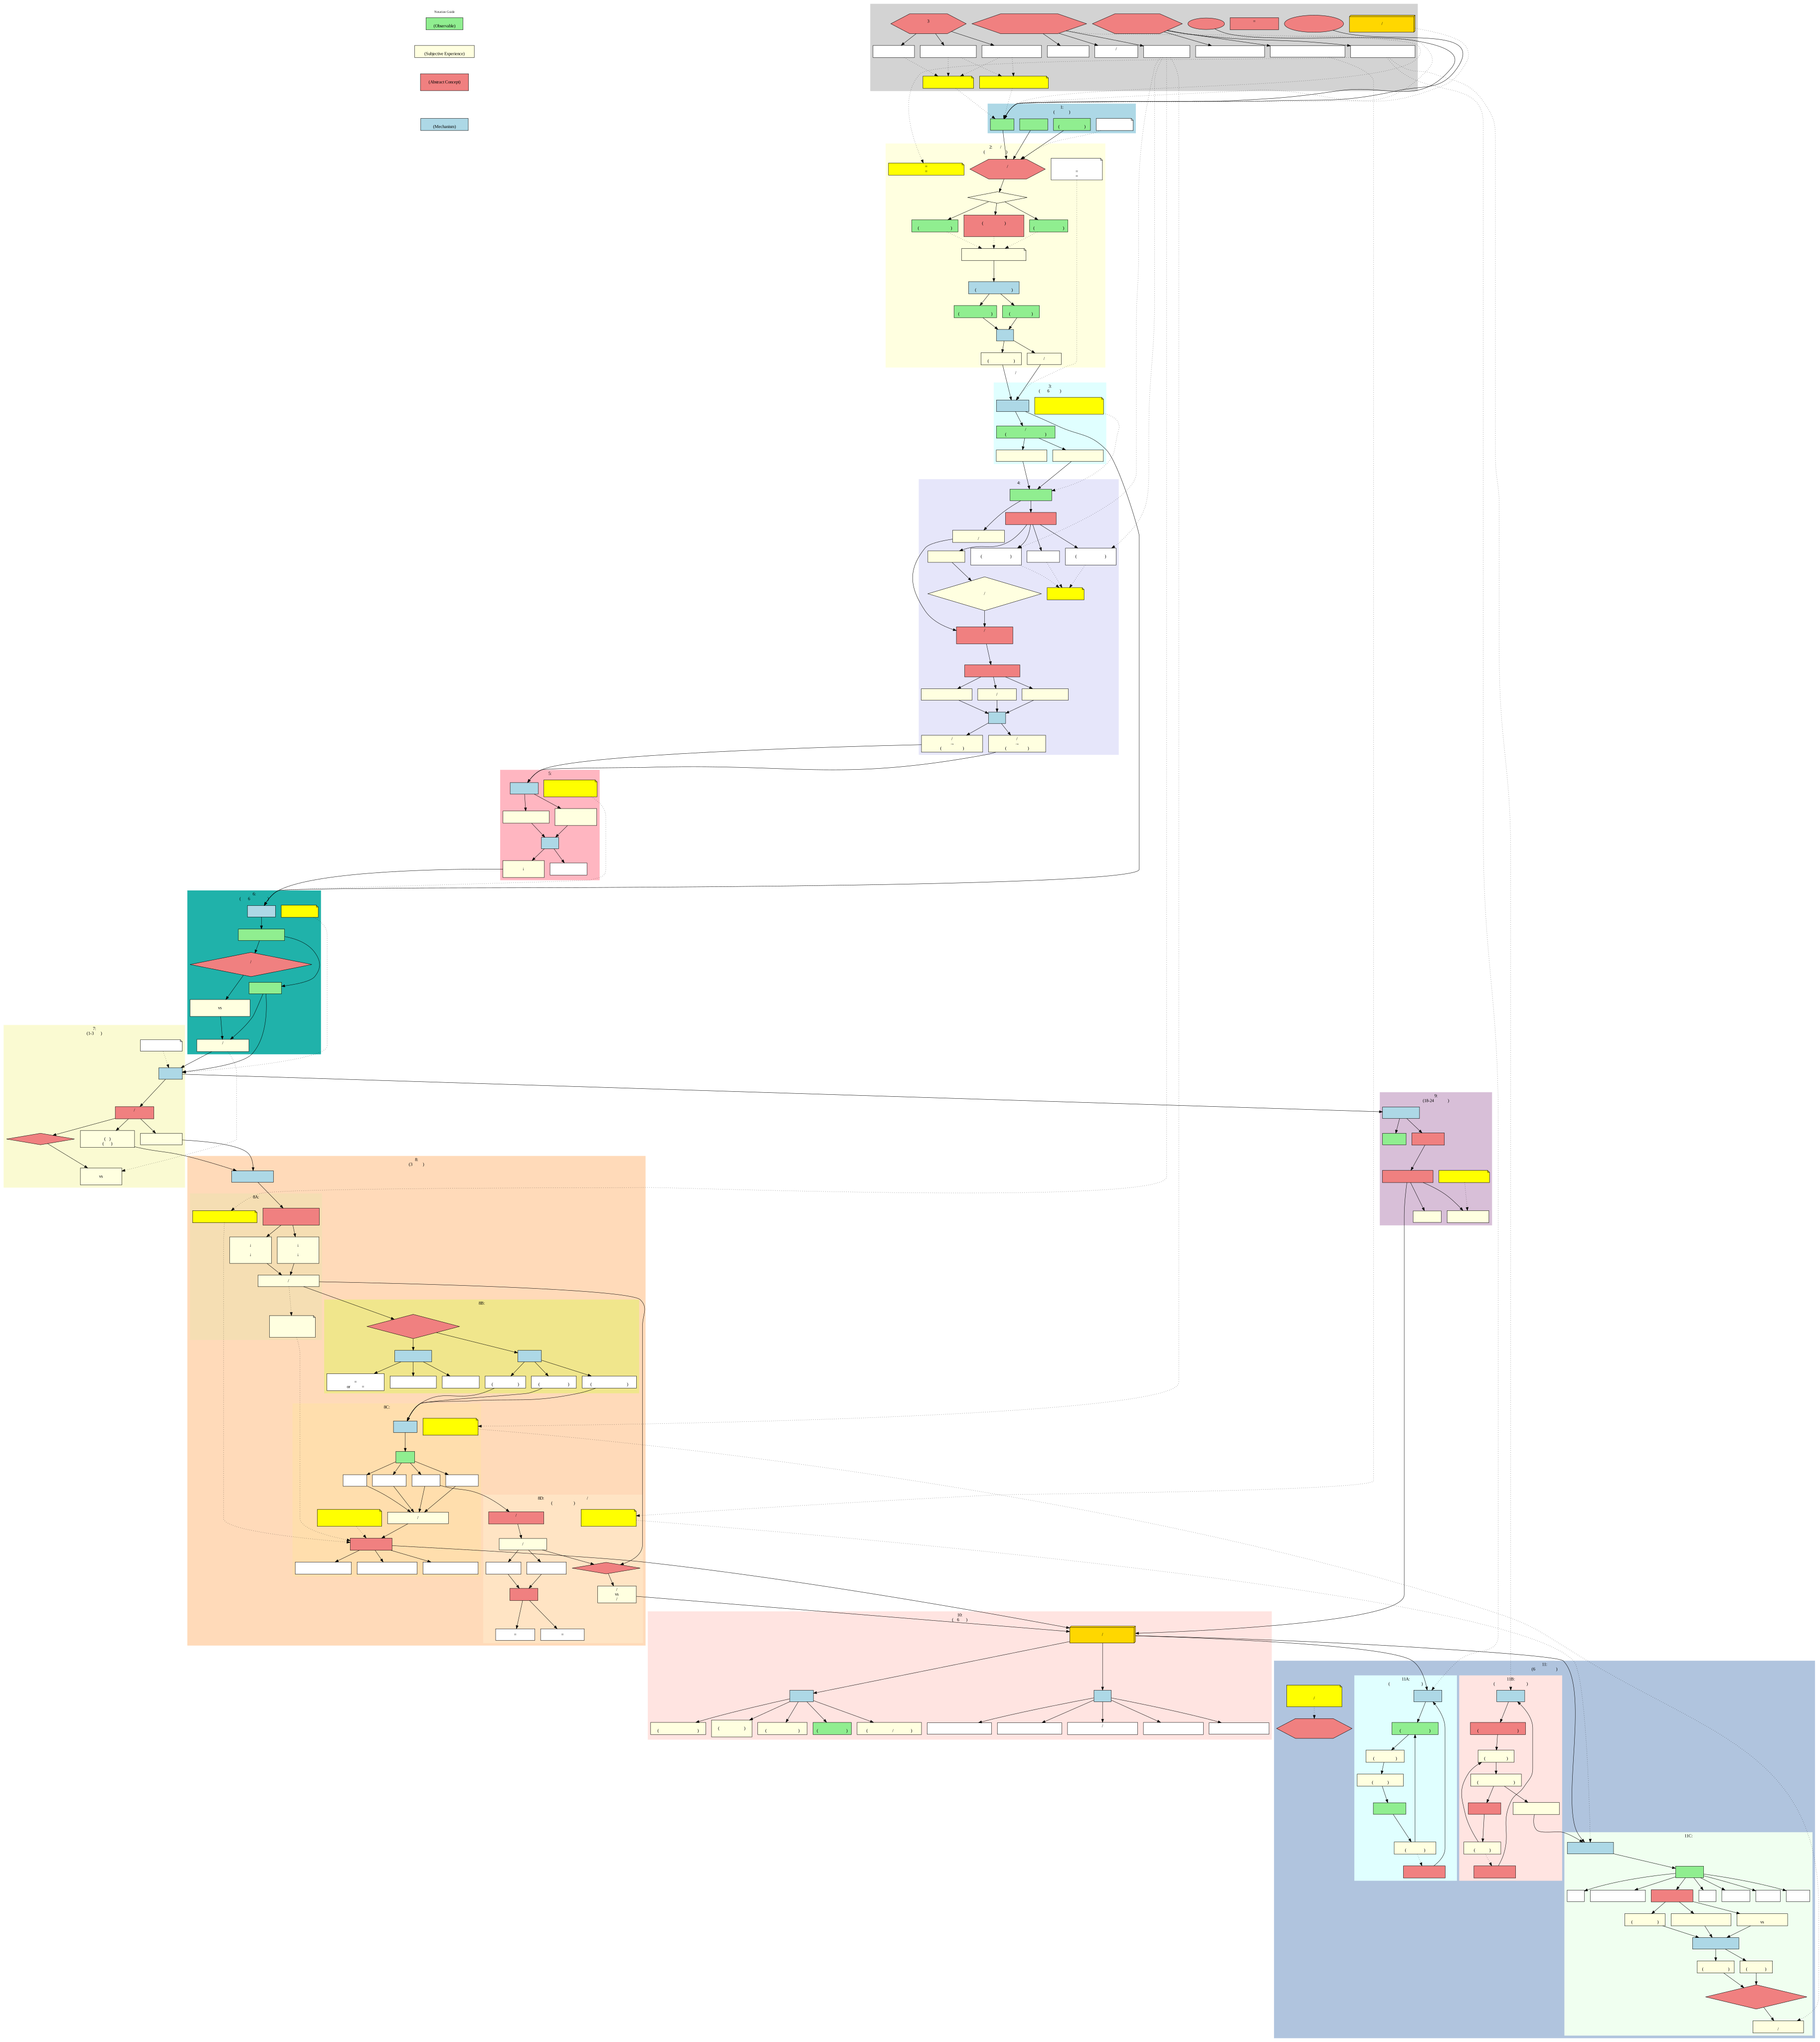
This is one of the densest surviving working maps. It distinguishes observable phenomena, subjective experience, analyst-created abstraction, and proposed mechanisms. It also separates personal, cultural, and institutional values while exploring how those layers might be learned, confused, maintained, revised, or rejected.
The diagram treats value formation primarily through a reward / punishment adaptation model. That unifying explanation is a working hypothesis, not an established theory.
Several structural questions in the diagram remained important later:
- When does a learned rule become experienced as "mine"?
- How are personal, cultural, and institutional rules distinguished?
- What happens when stated rules and observed behavior conflict?
- What happens when a community no longer delivers the protection or benefit that made compliance worthwhile?
- Can values remain updateable throughout life rather than becoming fixed identity objects?
3. Existence Desire Inquiry
Original: 存在欲求の探究マップ.dot
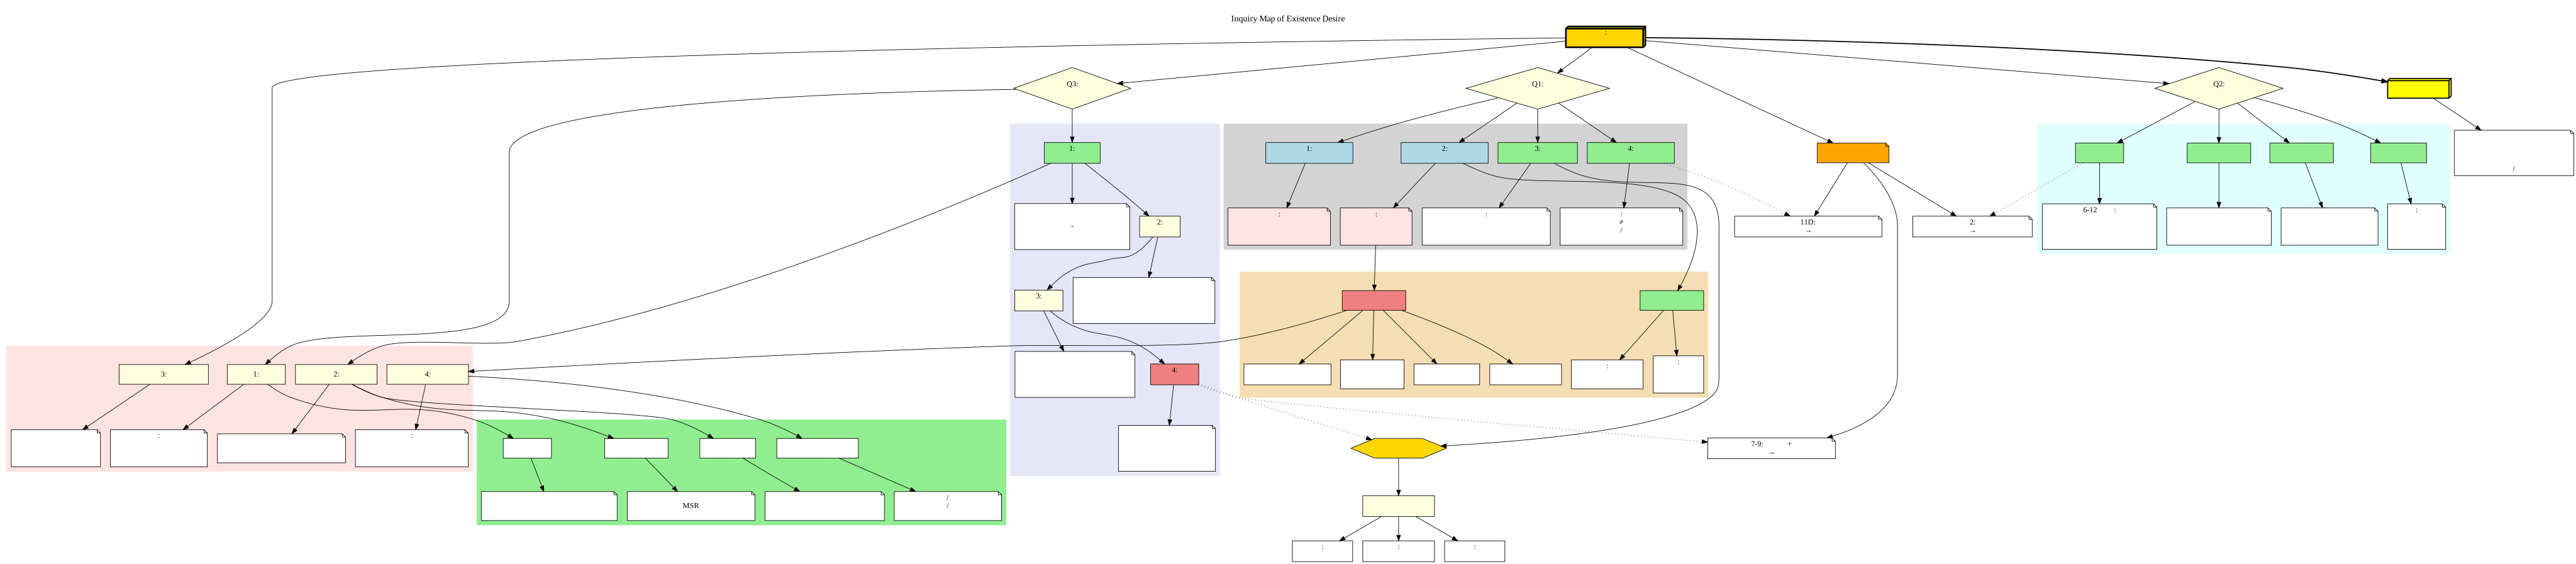
The central question is simple: What is the desire to continue existing, being recognized, or leaving a trace?
The diagram does not settle on one explanation. It tries survival instinct, reproductive strategy, narrative capacity, and participation in symbolic systems. It explicitly records limits to the first explanations and preserves unresolved questions about necessary and sufficient conditions.
This is especially important for provenance because the diagram retains failed explanatory routes rather than presenting the later hypothesis as inevitable.
It also explicitly reconnects the question to an earlier staged model involving attachment, language, self-recognition, and identity-related reward. The exact version history of that earlier model is not fully reconstructed here.
4. Long-term Self-interest and Cooperative Action
Original:
「究極の利己」が「無私」を生むパラドックスの身近な実例.dot
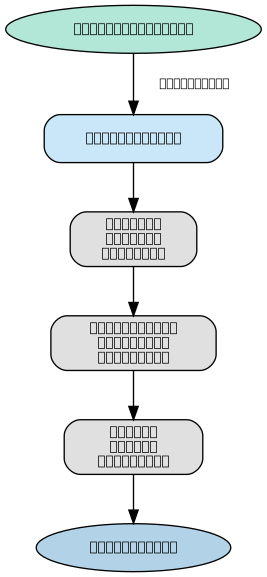
This small diagram asks whether apparently selfless action can emerge from a sufficiently long time horizon of self-interest.
The example is deliberately ordinary: helping a colleague without immediate compensation may improve trust, coordination, skill, reputation, and future opportunities.
The point at this stage was not that altruism is secretly selfish in every case. It was that short-term ego and long-term interest need not recommend the same behavior.
A more developed version of this logic later appears in historical and institutional models of cooperation and in The Paradox of Selfishness.
5. History Analysis Framework
Original:
歴史分析フレーム(完全版).dot
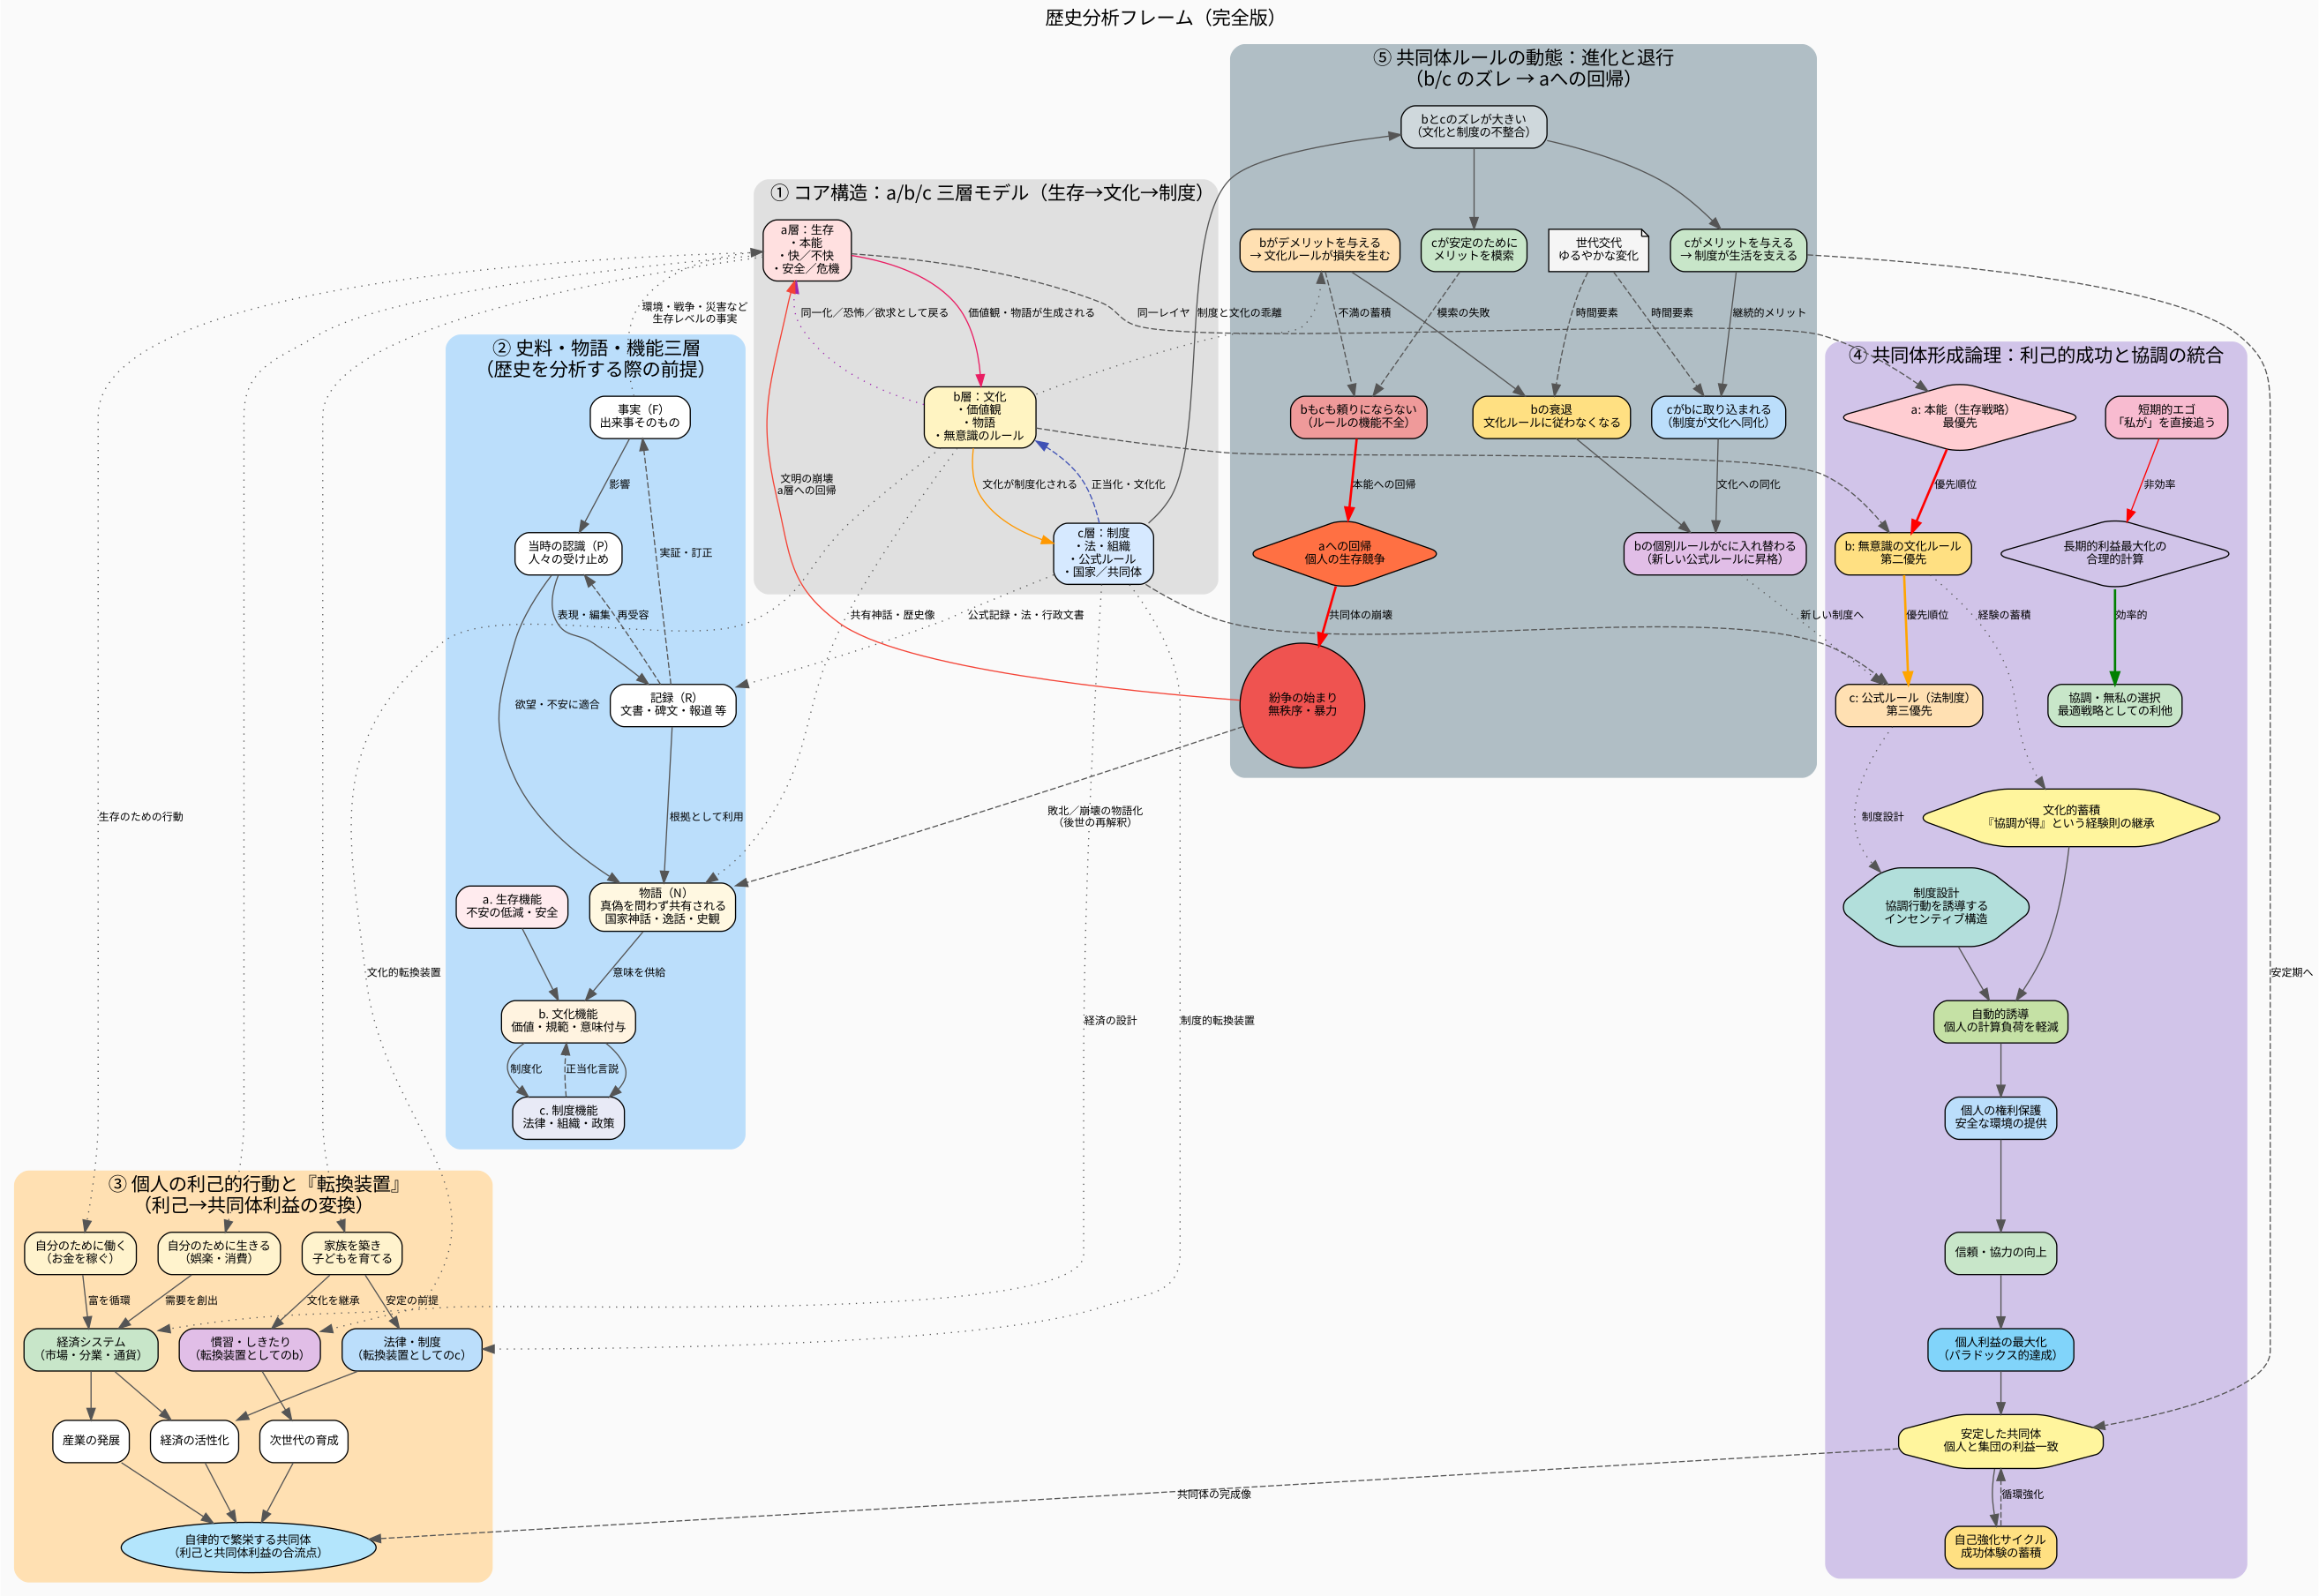
This diagram is an integration map rather than a single hypothesis.
It uses a three-layer model:
survival
→ culture
→ institution
and separately distinguishes:
Fact
→ Perception
→ Record
→ Narrative
It also explores how self-interested behavior may be converted into collective benefit, how cooperation can become culturally and institutionally embedded, and how mismatch between cultural and institutional rules may contribute to instability.
The later Research Notes on predictive processing, rule persistence, and premise alignment connect naturally to this framework, but that later connection should not be confused with proof that those ideas originated here.
6. Symbolic Destruction and Community Collapse
Original:
象徴破壊と共同体解体の構造分析.dot
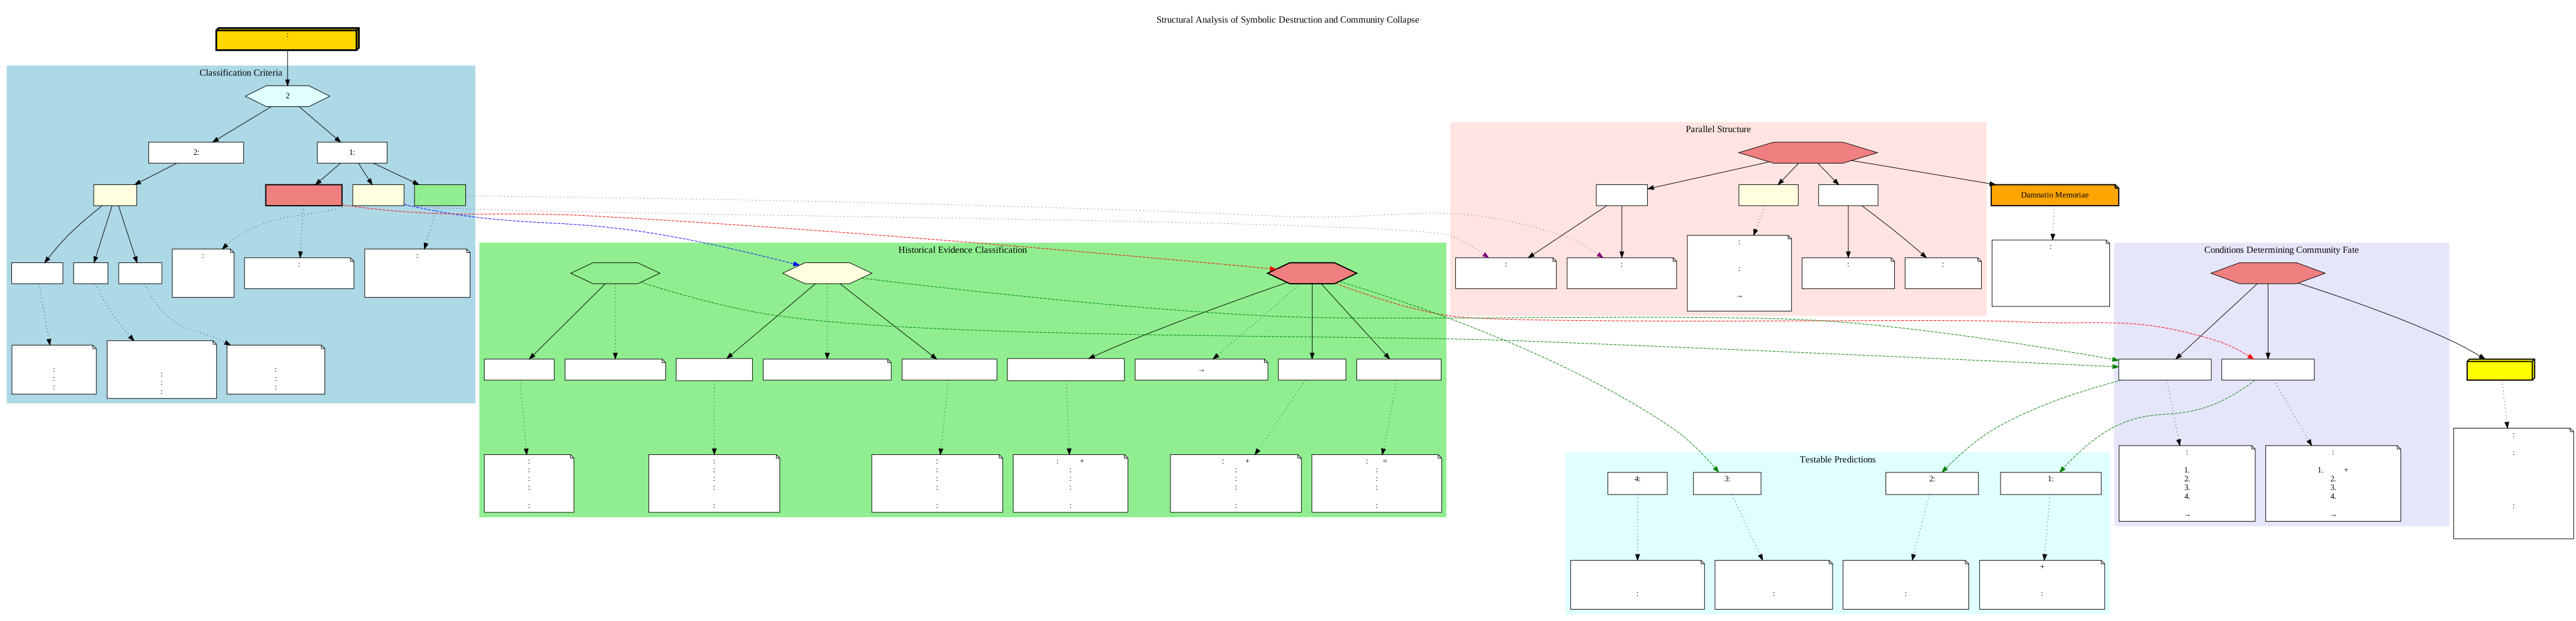
This diagram begins with a strong working hypothesis: destroying a community's symbols may damage the structures that hold the community together.
It then tries to make the claim more discriminating by classifying symbols through properties such as substitutability, concentration of meaning, and irreversibility. It compares historical cases and derives testable predictions.
Most importantly for this archive, the diagram labels itself as hypothesis-stage work and explicitly lists what remained unverified: statistical testing, causal mechanism, and systematic analysis of exceptions.
It also makes an explicit cross-scale comparison between an individual's desire for symbolic continuation and a community's cohesion through shared symbols. That is one of the clearest surviving links between the existence-desire inquiry and historical / institutional analysis.
Later Research Investigations
The DOT diagrams preserve working structure. The later AI-assisted / Notebook research reports preserve a different kind of evidence: what literature I was searching, which mechanisms I was comparing, and where exploratory synthesis became too strong.
Three Research Notes currently preserve that later trail.
When Reasons Evaporate
The question shifted from how rules are learned to why rules survive after the reason that once justified them disappears.
This investigation brought together norm persistence, causal opacity, ritualization, institutionalization, legitimacy, and the possibility that a rule can lose its original instrumental function while retaining social, identity, or coordination functions.
The connection to the older diagrams is visible, but not singular. The value-formation map already treated rules as adaptive and socially maintained, while the history framework treated cultural and institutional rules as dynamic systems. The later research asked a more specific question: what function is the rule serving now?
Predictive Processing and Cognition
This investigation moved toward the problem of correction.
If perception and memory depend on prior structure, reconstruction, and compression, then disagreement cannot be understood only at the level of explicit propositions. Different models may already shape what is noticed, retained, and treated as relevant evidence.
A key later distinction became:
model update
vs.
evidence assimilation
The older observation / evaluation diagram and the historical Fact / Perception / Record distinction are structurally related to this problem, but they should not be treated as neuroscientific precursors.
Negative Capability and Uncertainty
This investigation asks what happens when the system does not immediately resolve a discrepancy.
The useful operation became procedural rather than literary or neurological:
Keep an unknown explicitly represented as unknown when inventing a completion would destroy correction information.
This later became connected to Variable X, premise alignment, and the idea that suspension can preserve a search space without preventing action.
Visible Structural Continuities
Several continuities are visible across the surviving materials. They should be read as recurring questions, not as claims of originality or linear descent.
Observation before judgment
An early diagram tried to separate fact extraction from value-based evaluation. The historical framework later separated event, perception, record, and narrative. The predictive-processing investigation then complicated the very idea of unmediated observation.
The continuity is not "objective observation was proven." The continuity is the recurring attempt to prevent observation, interpretation, and evaluation from silently collapsing into one category.
Rules across personal, cultural, and institutional scales
The value-formation diagram explicitly separated personal, cultural, and institutional values. The history framework used a different taxonomy: survival, culture, and institution.
These taxonomies are not equivalent.
What recurs is the question of scale: which rule belongs to an individual adaptation, which is socially inherited, which is institutionally encoded, and what happens when those layers conflict.
Survival, trust, and cooperation
The value-formation map explored trust as an exchange between compliance costs and community-provided benefits. The self-interest diagram explored cooperation as a possible long-term strategy. The history framework then treated institutions and culture as mechanisms that can reduce individual calculation costs and stabilize cooperation.
Later work would become more cautious about reducing every value or cooperative act to reward optimization, but the structural question remained:
Under what conditions do individual incentives and collective stability reinforce rather than destroy each other?
Narrative and symbolic continuation
The existence-desire map explored narrative and symbolic selfhood. The symbolic-destruction map later compared individual symbolic continuation with community cohesion through shared symbols.
This is an explicit connection in the surviving material, but the causal mechanism remains unverified.
Correction
Across the later Research Notes, a more general question emerged:
What allows a system to remain correctable when its current model is useful, socially reinforced, emotionally protective, or institutionally legitimate?
This eventually connects the earlier domains without claiming that they instantiate the same physical mechanism:
human cognition
history
social systems
organizations
AI
The common method that now links these domains is premise alignment.
What This Map Does Not Establish
This map does not establish:
- exact creation dates for the older diagrams,
- a complete chronological sequence among them,
- a single origin for premise alignment or any later concept,
- empirical validity of hypotheses contained in the diagrams,
- causal identity between human, organizational, historical, and AI mechanisms,
- or originality relative to research traditions I had not yet encountered.
Some older diagrams contain claims I would now weaken, separate, or verify more carefully. They are preserved because revision is more informative when the earlier state remains visible.
Diagram Preservation Policy
For every surviving diagram in this page:
- The original DOT content is preserved unchanged.
- A SHA-256 hash is recorded in
diagram-manifest.json. - An ASCII-named DOT alias contains the same bytes for easier web linking.
- SVG is generated directly from that DOT source.
- Any future correction to the theory should be written as annotation or a new version, not silently rewritten into the historical artifact.
Research Trail Principle
The point of preserving these diagrams is not to prove that the current framework was present from the beginning.
The opposite is more important.
A useful research archive should preserve the period in which the answer was not yet known.
If a branch ended, the branch should remain visible.
If a hypothesis was too strong, the later correction should not erase the earlier claim.
If the origin of a connection is uncertain, the archive should say so.
The surviving diagrams therefore function as structural snapshots of thinking, while the Research Notes record how later investigation changed the interpretation of those structures.
Later Updates
2026-09-07
Created this map from six surviving DOT working diagrams and the first three Research Notes derived from later AI-assisted / Notebook research.
The map intentionally distinguishes explicit source-level connections, later documented connections, and retrospective structural resemblance.
Note on Provenance
The original diagrams are Japanese-language working artifacts. They are preserved in their original form rather than translated or cleaned up, because wording, labels, and branching structure are themselves part of the provenance.
The English prose on this page is a later annotation layer.
Where I can observe a connection, I document it. Where I cannot establish lineage, chronology, or causality, I leave it unresolved.